


Spiio Integrates with Google: Integrate Spiio data into your existing spreadsheets for personalized reports and dashboards.
Superintendent Adam Hoffman from Sunset Hills Country Club discusses how he uses Spiio’s Google Sheets integration for data-driven reporting, allowing him to back up his agronomic decisions with data. He built a dashboard on Spiio’s Google Sheets Plugin and combined it with other data sets, like weather data from his own weather station, TDR readings, and his tracking of the playability conditions on the golf course. He can now use his dashboard, which updates with only one or two clicks, to track live agronomic conditions as well as to go back in time to understand the context behind his previous decisions.

Adam Hoffman, Golf Course Superintendent of Sunset Hills Country Club
Adam has been working in the golf industry for 23 years. What began as a high school summer job evolved into a career that took him to a variety of different courses. Adam earned a degree in Ornamental Horticulture and Landscape Design with a concentration in Turfgrass Management from the University of Tennessee in 2004.
He spent the next 10 years serving as an Assistant Superintendent at several clubs in Tennessee and Georgia, including three years at Marietta Country Club and five years at Sunset Hills from 2010 – 2014. Adam served as Director of Golf Maintenance, overseeing multiple courses in Dekalb county, and most recently as the Golf Course Superintendent of The Frog Golf Club in Villa Rica. He is the Golf Course Superintendent at Sunset Hills today.
About Sunset Hills Country Club
Sunset Hills Country Club delivers the premier golf experience in West Georgia.
Regarded as one of the true hidden gems in West Georgia, Sunset Hills Country Club’s Robert Trent Jones designed course delivers a challenging golf experience for low-handicappers, while providing playability for higher-handicappers and beginners alike.
In addition to delivering a challenging, yet rewarding golf experience for players of all skill levels, Sunset Hills takes tremendous pride in providing a scenic backdrop for its members to enjoy their round. Highlighted by immaculate turf conditions, the course weaves its way through towering Georgia pines and offers beautiful visuals of the Sunset Hills lake which comes into play on several holes on both sides of the course.
Spiio delivers on an increasing demand for reporting in sports turf management.
Spiio customers can now use a plugin for Google Sheets to access their Spiio data with just a click and build upon it with tailored reports or more advanced data-driven models. You can build simple graph automations for your reporting, or you can create models for your irrigation management system. You can also combine the data with other field data to create your own individual dashboard with the exact insights you care about.
Superintendents and their assistants explain that they use Spiio data as a basis for their agricultural decisions, optimizing the playability conditions of the golf course. We also hear often that the need for data-backed reporting is increasing. Rising water prices, water regulations or yearly changing playability conditions are just some of the reasons people tell us it is so valuable to be able to look back in time. You can review last year’s data and understand the circumstances you were facing a year ago when you made a specific decision.
“You never know what the focus might be next year. That is why I like data in Google Sheets so much. I can go in and pick the data I need to show. Then I can look back in time to understand and communicate why I made the decision and how the situations differ to last year. Looking back into my Spiio data helps me to comprehend my decisions,” says Adam Hoffman
Adam Hoffman mentions that he is constantly tracking playability conditions. Questions naturally arise about why the conditions change on a yearly basis. There are many factors that can affect playability. This season, for example, Sunset Hills had a long season and some trouble with fungicides. Next season will come with different challenges.
Using the plugin is very easy.
Few superintendents are into coding or have a technology department working for them. Spiio wanted to make it easy for everyone to use their data and adjust it to their individual needs.
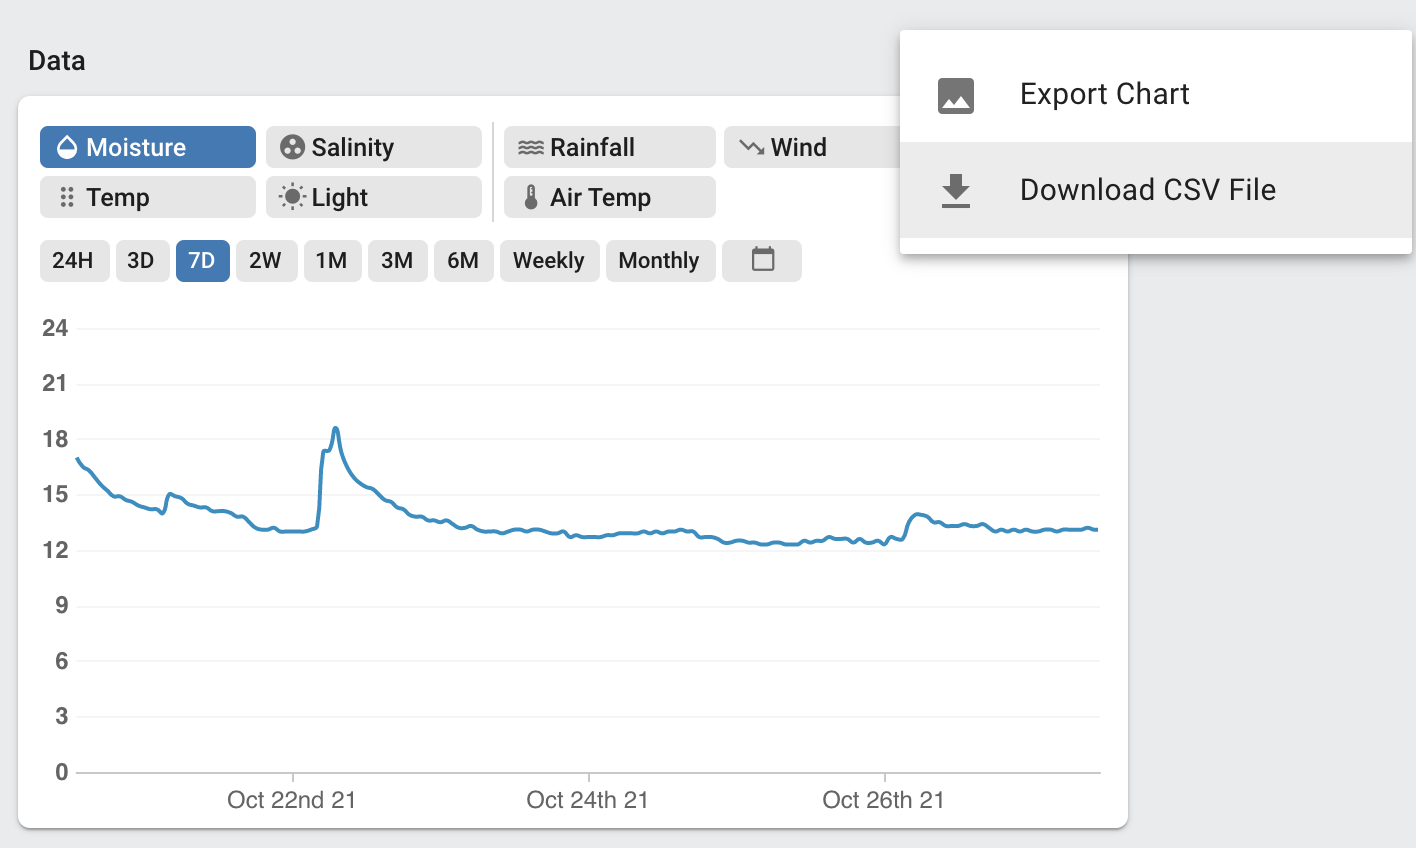
Exporting a chart or downloading a CSV file within the Spiio App has always been easy. Whatever data you are displaying gets converted. But if you want to build, for example, a standardized reporting structure on top of the data, there is now a better way to do it so that you can combine it with different data sets to show relations like the relation between in-ground data and playability conditions.
You would probably like to have direct access to your complete data set, where you can pick the data area you need and refresh it with a single click. The Google Sheets Plugin is connected to the Spiio API. Clicking on the plugin loads the Spiio data directly into your spreadsheet.
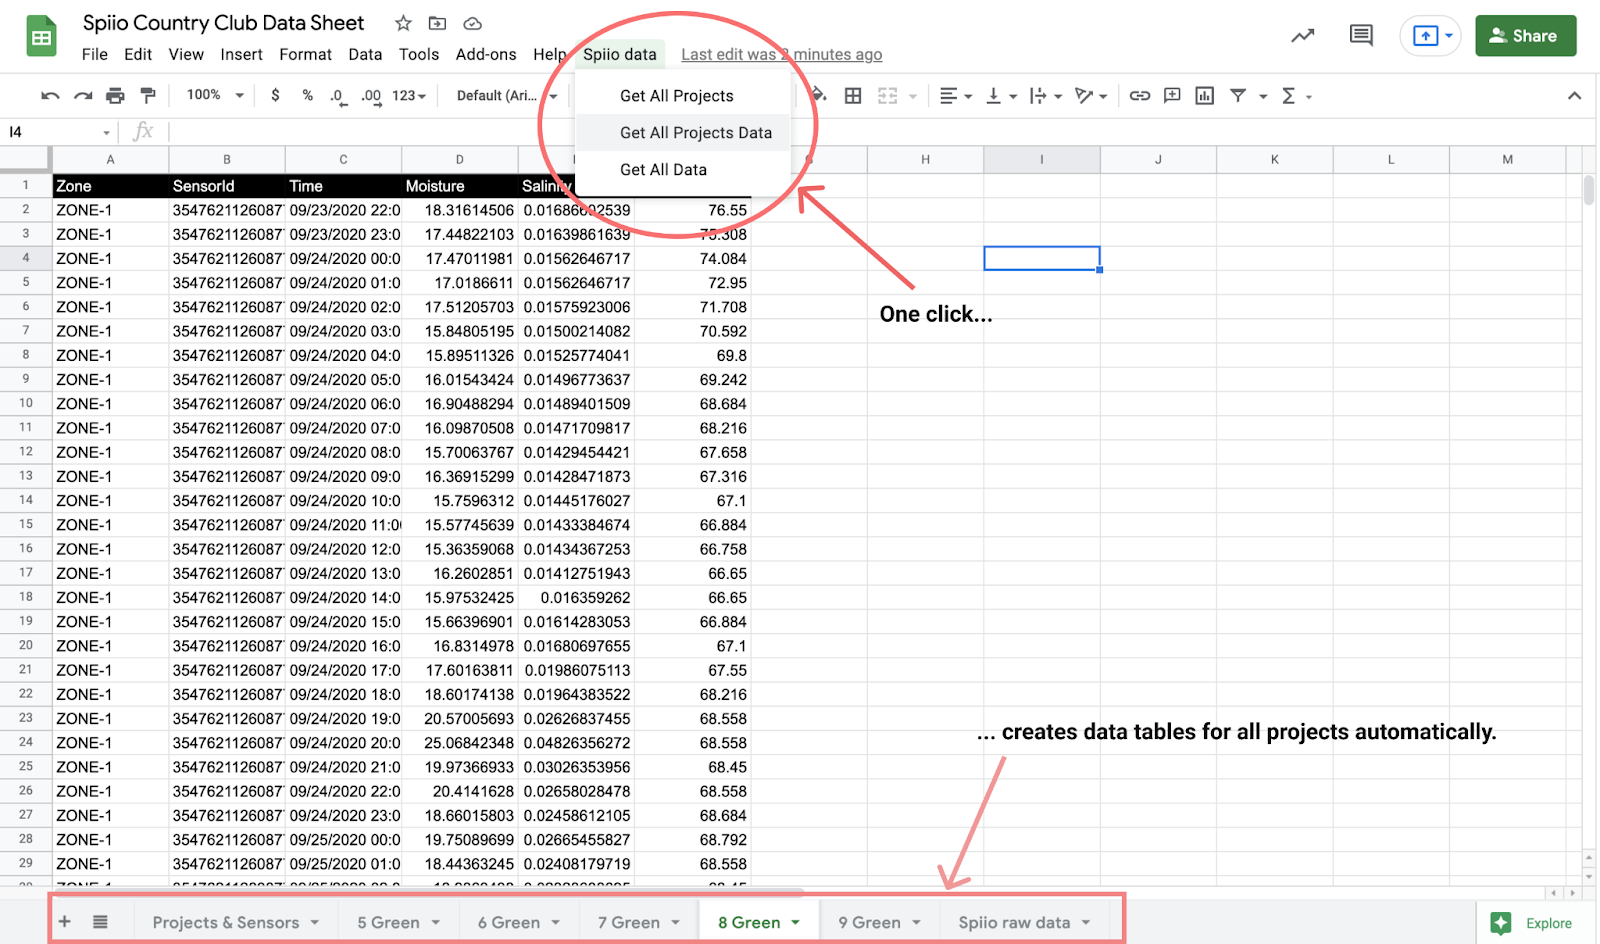
Working with the plugin is very easy. You will get a fast overview of your projects and the Spiio IDs of your installation. By clicking one button in Google Sheets, the plugin generates a data sheet with moisture, salinity, and temperature readings for each project in your organization. The timespan and the sampling of your readings can be adjusted by Spiio according to your needs. From there, it is easy to generate the reports needed for your greens committee or to build more advanced functionalities on top of the data. The script accesses Spiio’s open API, downloads the data, and makes it easily accessible.
Building or integrating Spiio on one click into your advanced spreadsheet models
Many Spiio customers are used to working with spreadsheets already. They collect moisture data in the field and weather data from weather stations.They might also track playability conditions in a spreadsheet. Some are building irrigation and pesticide application logics on top of this data. The most common irrigation systems have user interfaces that are based on spreadsheet logic.
Imagine that the manual part of collecting readings on a piece of paper and communicating this to the office has just been solved by one click on the plugin. The Spiio data directly integrates into your spreadsheet models.
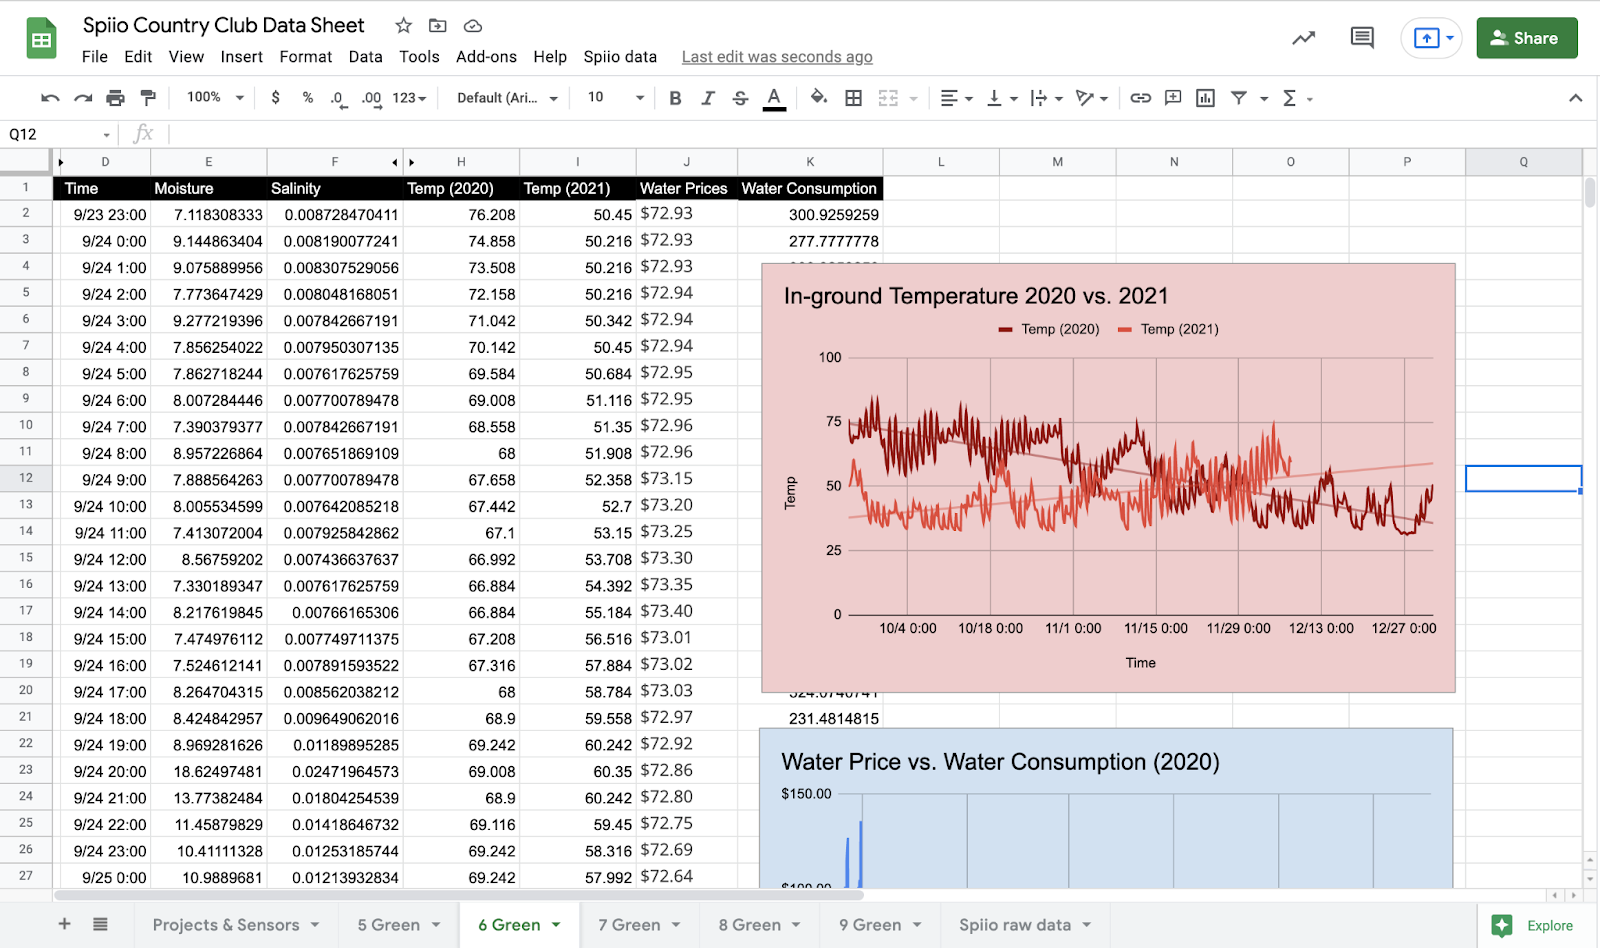
Adam has to combine several data sets. He is tracking TDR measurements and weather data from his own weather station. He has also been tracking cutting yields for a while now to optimize his machinery maintenance, and he tracks playability conditions in a spreadsheet. There is no tool out there that can completely solve all of his needs. Combining these data sets with the Spiio data in only one click, and building graphs for a presentation or a chart for his dashboard, is an incredible help in his day-to-day routines. The Google Sheets Data Plugin that Spiio has created for him facilitates his efforts. Instead of exporting the data from the app, he simply presses the Spiio button and he gets the most recent data into the spreadsheet. It frees up time for other tasks and helps him to keep the overview.
“I noticed that, since I am tracking data, I tend to get drier and drier on the course. I sometimes even go down to 15% moisture level, because I can back my decision with data. Before I had this knowledge there, I had the tendency to over-irrigate, because you need to be sure that the turf is not drying out.”
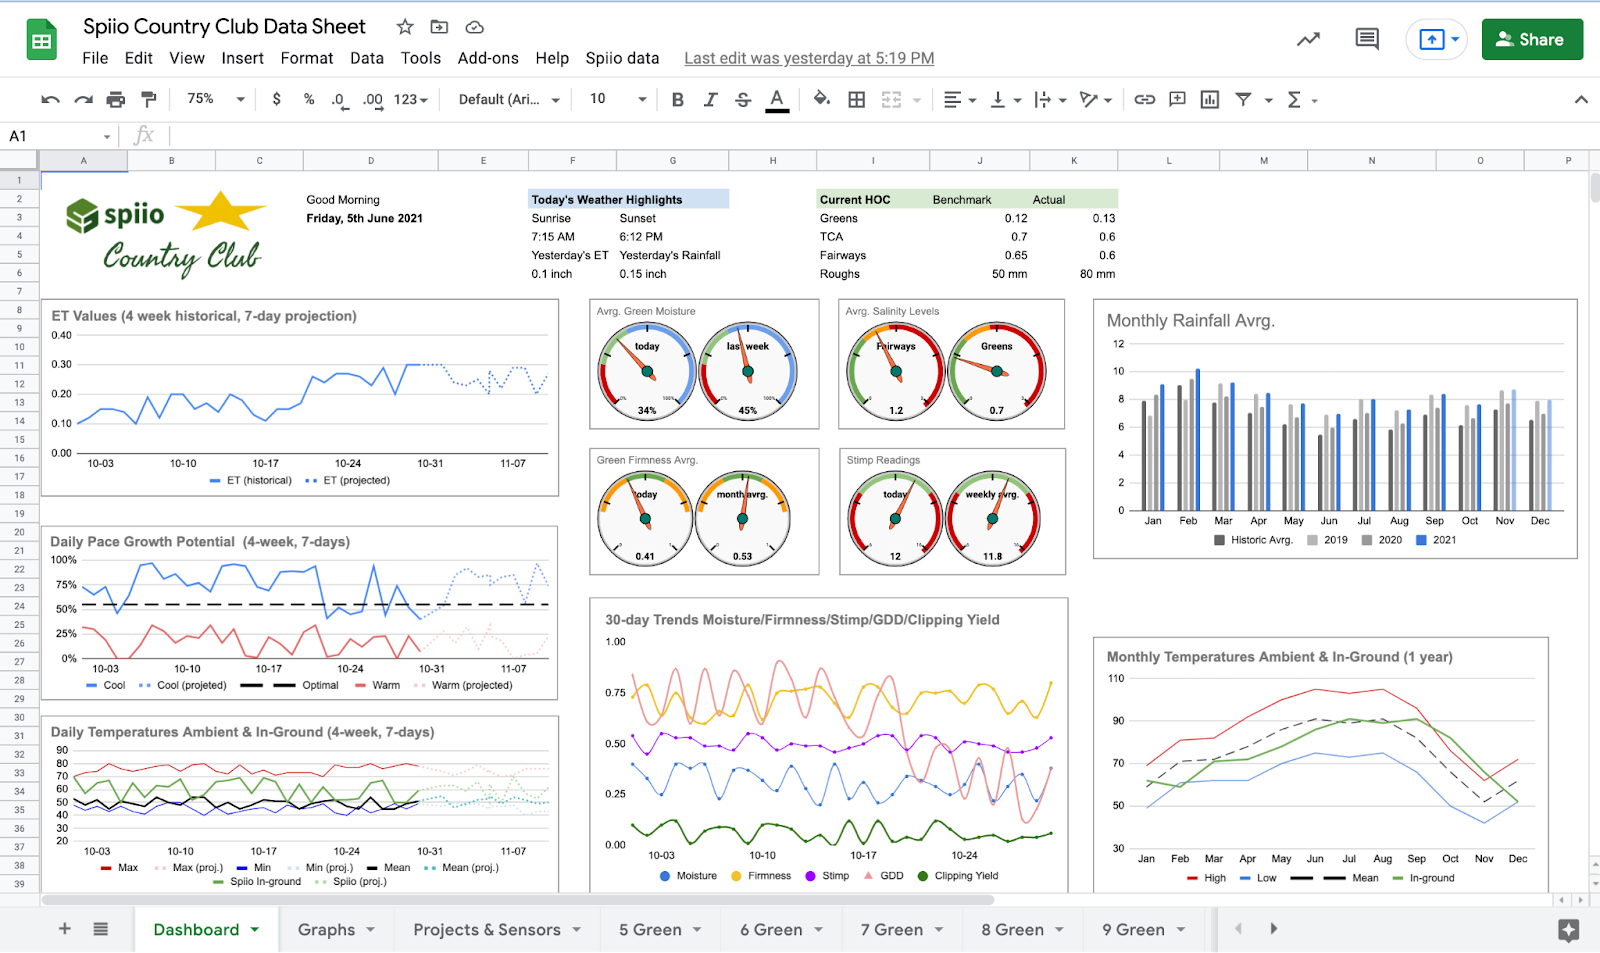
Adam built a whole live dashboard on top of the data that shows him the most important graphs he needs for his daily routine. The advantage of a spreadsheet integration is that it can integrate seamlessly into these already existing models and workflows without needing to write a single line of code.
The need for reporting and decision-making can vary from state to state, greens committee to greens committee, and superintendent to superintendent. The beauty of this plugin is that it can integrate into every spreadsheet without one line of code. Instead of you working for the data, you can make the data work for you